These two Downtown streets are only 10 minutes apart; but you’ll pay five times more for an apartment on one of them – View Average Price per Sqft for All Downtown Buildings
KEY TAKEAWAYS:
- The most expensive stretch of Downtown Vancouver apartments is on West Cordova at $2000-$3500 per square foot
- A couple of the most affordable buildings in Downtown Vancouver are located in the stretch of Harwood Street at 600-700$ per square foot.
Most metropolitan minded people simply accept that living near the Downtown core of any city will be expensive. Proximity to amenities, work, school all contribute to a high-quality lifestyle that many seek to take advantage of despite the cost of living being perhaps exorbitantly high. But can you paint each Vancouver street with the same lucrative brush?
An analysis by Roomvu Technologies, a Vancouver-based real estate analytics company, looked at MLS (Multiple Listing Service) data for buildings located in Downtown Vancouver between 2018 and 2019. The data allowed them to pinpoint the most expensive and the most affordable city blocks in the area based on price by square foot.
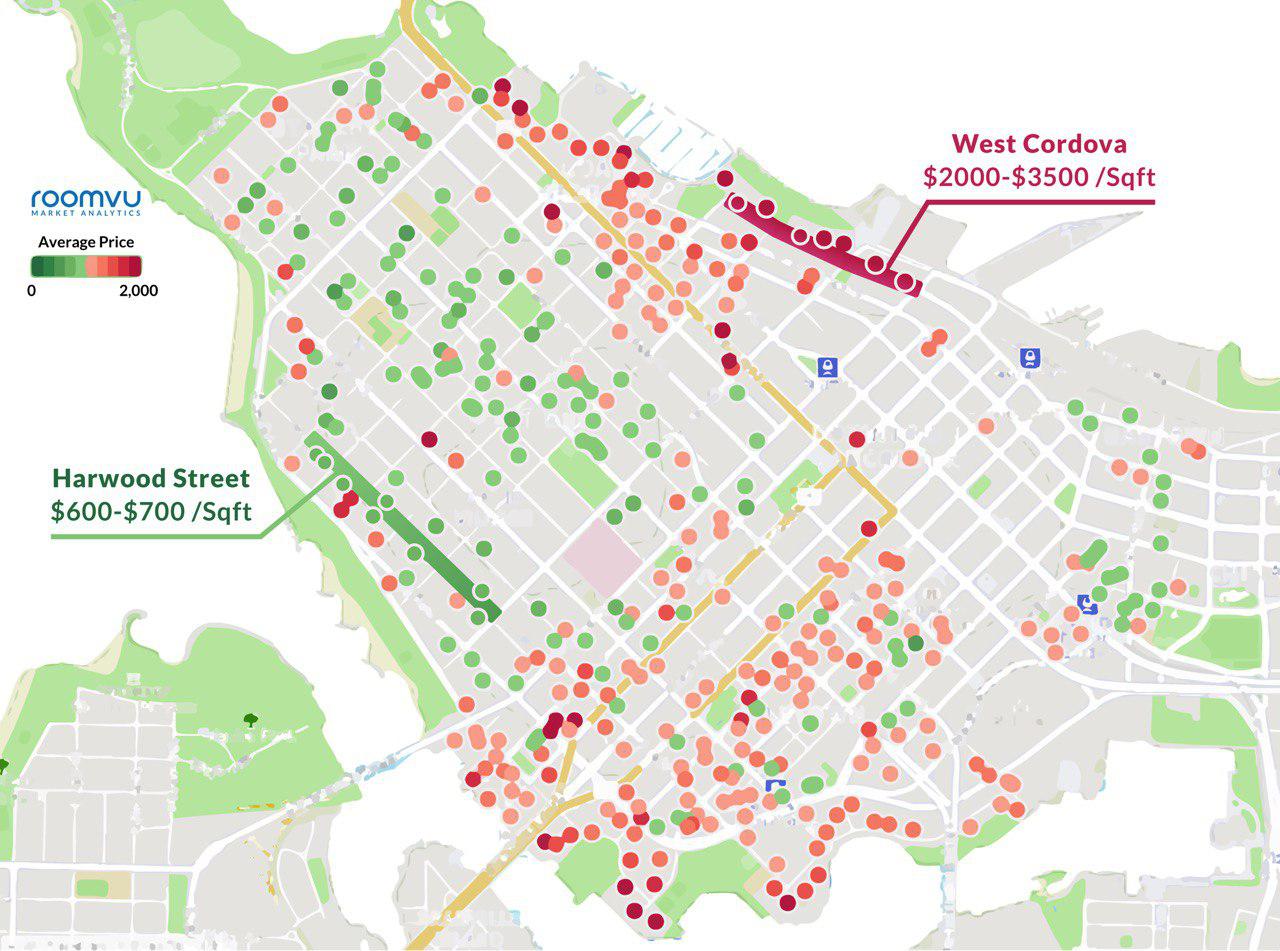
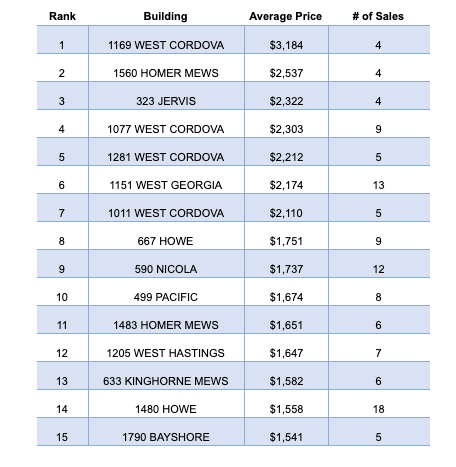
The results? Residents can expect to pay somewhere between $2000-$3500 per square foot to live in the 10, 11 and 12 blocks of West Cordova street. Those who live on the other side of Downtown, in False Creek, don’t fare much better. Price per square foot at Homer Mews (at the intersection of Homer Street and Beach Crescent, costs upwards of $2500.
Click here to view an interactive map of prices per square foot in Vancouver


Figure 1. Average Sales Price for Buildings in Downtown Vancouver (Condos, 2018-2019)
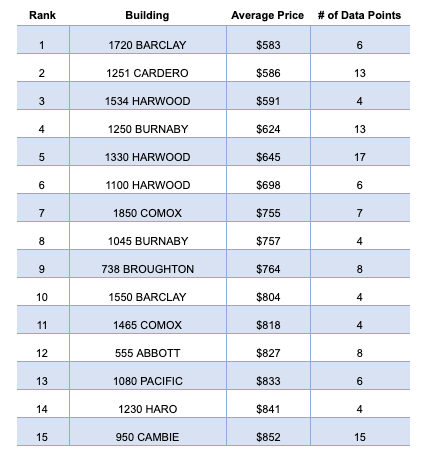
But buildings at the higher-end like those mentioned above aren’t necessarily the norm – prices per square foot just a short drive away can be as much as five times lower. Take for example the building at 1219 Harwood street, price per square foot there is only $582 or prices at 1534 Harwood street are only $591. As it is shown in Figure 1, Harwood Street is home to a couple of the most affordable building.
Most expensive buildings in Downtown Vancouver per square foot (average price based on at least 4 sales)


Most affordable buildings in Downtown Vancouver per square foot (average price based on at least 4 sales)


So what explains this discrepancy in price given that these buildings are all in relatively similar locations?
Buildings nearest to Coal Harbour are not only located very close to the water, but offer world-class views of the North Shore mountains. No matter the season, these breathtaking vistas are worth shelling out the extra money – if you have it in the first place.
And while buildings adjacent to False Creek might not look out onto the mountains like those in Coal Harbour, views of the lower mainland looking east or south, and English Bay to the west, are nothing to scoff at.
That isn’t to say residing in a building on Harwood or Barclay Street leads to a life in the doldrums. Living on these streets still allows for quick access to commercial districts, parks and beaches. Although it could be argued that being able to enjoy the views from one’s living room is a lot more desirable than having to walk 10 minutes to enjoy similar ones.
Regardless of where one lives in Downtown Vancouver, life is expensive. And although some blocks and neighbourhoods are considerably more expensive than others, at the end of the day, whether it’s enjoying views of the North Shore mountains while you cook breakfast, or living a short walk away from the beach, you get what you pay for.
Note: The sales data of all the sold units in the downtown apartment buildings in 2018 and 2019 (first 9 months) were used to calculate the average sales price per square foot for the buildings. The building names and numbers were extracted from the address data and the average price was calculated for any number of listings sold in that building since January 2018.
It is of course evident that the prices presented in here is just the average price for that building and the price for each unit could be different based on the floor number the unit is located and the quality of renovations made in that specific unit. It should also be mentioned here that the tables show the results only for buildings with at least 4 sales in 2018-2019 data bank while the map shows all the building’s prices even if only one sale is available in the data bank.


Responses