20 luxury condos on West Cordova, Georgia Street, Marinaside Crescent and Homer Mews experienced a $2.5–to–$5.8 million drop in value due to 2020 BC Assessment
Landowners across British Columbia eagerly await the yearly property evaluation performed by BC Assessment. The results help determine the rate of taxation those who are lucky enough to own property can expect. It can also be an anxious time for those who view real estate as an investment and plan to sell in the near-to-medium term future.
The January 2020 property assessment notice sent to more than one million property owners in the south-west corner of BC’s mainland showed a drop in home values for almost all properties except for some located in Whistler and Pemberton.
Data scientists at Roomvu examined data from the assessment and highlighted the top 20 most precipitous drops in total assessment value of residential strata units in the city of Vancouver. Properties categorized as multi-family dwellings and comprehensive developments were considered in the analysis. These two categories mainly comprise apartments and condominiums in the city and exclude single-family homes.
The value of the 20 units in the study decreased by between $2.5 million and $5.8 million, with a cumulative decrease in value of over $64 million. As a percentage, these units dropped between 10% and 25%, which constitutes a massive loss in property value.
Nine of the 20 units—including the 5 with the most significant decreases—are located in 1011, 1077, 1139 and 1169 buildings of West Cordova Street. Three more units can be found in the 1128 and 1151 buildings of Georgia Street; 1560 Homer Mews also has three of the top 20. 1328 Marinaside Crescent holds two units, while 277 Thurlow Street, 667 Howe Street and 151 Athletes Way all contain one apiece.
The dollar and percentage change, as well as 2019 versus 2020 price assessment, can be seen in Table 1 below.
| Building Number | Street Name | Assessment 2020 ($) | Assessment 2019 ($) | Amount Drop ($) | Percent Decrease (%) | |
| 1 | 1011 | CORDOVA ST W | $24,334,000 | $30,197,000 | -$5,863,000 | 20 |
| 2 | 1169 | CORDOVA ST W | $17,060,000 | $21,677,000 | -$4,617,000 | 20.3 |
| 3 | 1011 | CORDOVA ST W | $24,063,000 | $28,226,000 | -$4,163,000 | 14.7 |
| 4 | 1077 | CORDOVA ST W | $16,379,000 | $20,172,000 | -$3,793,000 | 21.2 |
| 5 | 1169 | CORDOVA ST W | $14,473,000 | $17,849,000 | -$3,376,000 | 19 |
| 6 | 1128 | GEORGIA ST W | $18,312,000 | $21,484,000 | -$3,172,000 | 15.2 |
| 7 | 277 | THURLOW ST | $29,213,000 | $32,339,000 | -$3,126,000 | 10.8 |
| 8 | 1139 | CORDOVA ST W | $14,952,000 | $18,053,000 | -$3,101,000 | 16.8 |
| 9 | 1077 | CORDOVA ST W | $18,060,000 | $21,008,000 | -$2,948,000 | 14.1 |
| 10 | 667 | HOWE ST | $13,749,000 | $16,658,000 | -$2,909,000 | 18.7 |
| 11 | 1139 | CORDOVA ST W | $18,330,000 | $21,195,000 | -$2,865,000 | 13.3 |
| 12 | 1169 | CORDOVA ST W | $14,809,000 | $17,639,000 | -$2,830,000 | 15.8 |
| 13 | 1328 | MARINASIDE CRES | $10,364,000 | $13,192,000 | -$2,828,000 | 24.5 |
| 14 | 1328 | MARINASIDE CRES | $10,021,000 | $12,777,000 | -$2,756,000 | 24.6 |
| 15 | 151 | ATHLETES WAY | $11,584,000 | $14,322,000 | -$2,738,000 | 21.7 |
| 16 | 1560 | HOMER MEWS | $11,756,000 | $14,471,000 | -$2,715,000 | 21.9 |
| 17 | 1151 | GEORGIA ST W | $10,724,000 | $13,430,000 | -$2,706,000 | 24.5 |
| 18 | 1560 | HOMER MEWS | $11,247,000 | $13,872,000 | -$2,625,000 | 21.9 |
| 19 | 1560 | HOMER MEWS | $18,707,000 | $21,306,000 | -$2,599,000 | 13.7 |
| 20 | 1151 | GEORGIA ST W | $9,999,000 | $12,541,000 | -$2,542,000 | 24.7 |
(Unit numbers are not included in this table intentionally)
Conversely, many commercial properties in Vancouver saw an increase in their 2020 value assessment. The top 20 commercial properties are listed below; their increases in value ranged from $0.8 million to $3.1 million, with a cumulative total of around $26 million.
6333 West Boulevard is the most noteworthy building in the study, as it appears 11 times in the top 20 list, including seven of the top 10.
| Building Number | Street Name | Assessment 2020 ($) | Assessment 2019 ($) | Amount Raise ($) | Percent Increase (%) | |
| 1 | 6333 | WEST BOULEVARD | $6,815,000 | $3,690,477 | $3,124,523 | 85 |
| 2 | 1570 | 7TH AVE W | $26,156,000 | $23,758,000 | $2,398,000 | 10 |
| 3 | 943 | BROADWAY W | $4,287,000 | $2,268,000 | $2,019,000 | 89 |
| 4 | 1212 | BROADWAY W | $20,369,000 | $18,516,000 | $1,853,000 | 10 |
| 5 | 6333 | WEST BOULEVARD | $3,028,000 | $1,620,956 | $1,407,044 | 87 |
| 6 | 6333 | WEST BOULEVARD | $2,683,000 | $1,457,840 | $1,225,160 | 84 |
| 7 | 6333 | WEST BOULEVARD | $2,551,000 | $1,355,894 | $1,195,106 | 88 |
| 8 | 6333 | WEST BOULEVARD | $2,521,000 | $1,355,893 | $1,165,107 | 86 |
| 9 | 6333 | WEST BOULEVARD | $2,669,000 | $1,508,814 | $1,160,186 | 77 |
| 10 | 6333 | WEST BOULEVARD | $2,516,000 | $1,427,256 | $1,088,744 | 76 |
| 11 | 3888 | MAIN ST | $5,640,000 | $4,602,000 | $1,038,000 | 23 |
| 12 | 6333 | WEST BOULEVARD | $2,528,000 | $1,508,813 | $1,019,187 | 68 |
| 13 | 1570 | 7TH AVE W | $12,033,000 | $11,015,000 | $1,018,000 | 9 |
| 14 | 2116 | 47TH AVE W | $2,819,000 | $1,845,239 | $973,761 | 53 |
| 15 | 2108 | 47TH AVE W | $3,083,000 | $2,110,301 | $972,699 | 46 |
| 16 | 1821 | ROBSON ST | $15,086,000 | $14,150,000 | $936,000 | 7 |
| 17 | 2112 | 47TH AVE W | $2,710,000 | $1,804,459 | $905,541 | 50 |
| 18 | 785 | DENMAN ST | $11,594,000 | $10,701,000 | $893,000 | 8 |
| 19 | 6333 | WEST BOULEVARD | $2,494,000 | $1,610,761 | $883,239 | 55 |
| 20 | 6333 | WEST BOULEVARD | $2,439,000 | $1,580,176 | $858,824 | 54 |
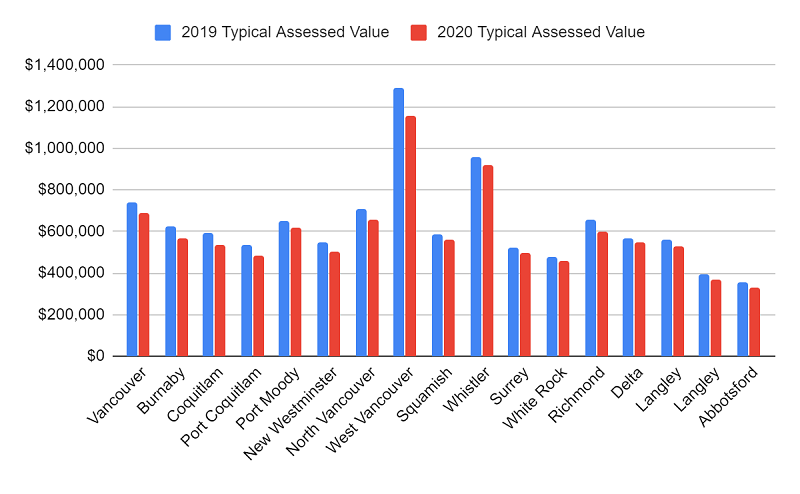
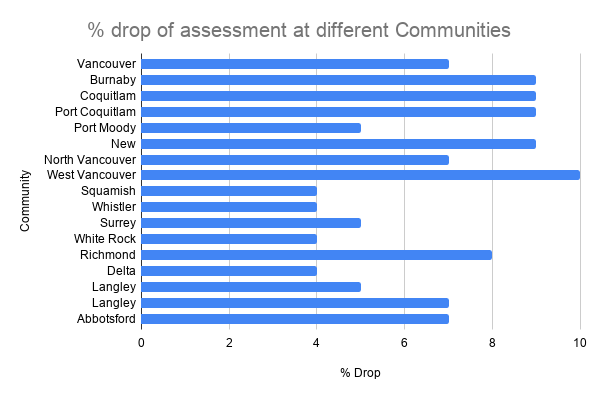
However, broadening the study to the Lower Mainland-plus-Whistler, residential strata units and condominiums have experienced anywhere from no change to a 15% drop in assessed value based on the jurisdiction or municipality in which they reside, in addition to the property’s characteristics. The typical assessed value and corresponding percentage drop for strata residential across different municipalities in the Lower Mainland-plus-Whistler are shown in figures 1 and 2. Properties in West Vancouver experienced the highest drop in strata values, and the municipalities of Squamish, Whistler, Delta and White Rock the lowest.


A significant drop in property assessments has a wildly different impact on a homeowner depending on how they view their home. One who views their domicile as a place to live out their days benefits from a drop in property assessments, as the amount of tax they would pay in a given year is lessened.
That said, someone who views their property as an investment would be understandably worried by a drop in value, as its potential resale would most likely fetch a lower price. Despite an ability to defer property taxes, intuitively, most would appreciate wanting to avoid negative changes to an investment.
While the 2020 BC Assessment has dramatically impacted the value of some condos in a negative way, it would be wise to take a broader look at property values and see their relative increase over the past decades as opposed to myopically focusing on one year.
