Ever since the 1986 World Exposition in Vancouver, the city and surrounding areas have come to be seen as some of the most desirable locations to live on Earth—with housing prices reacting accordingly.
Vancouver is blessed with natural beauty unparalleled by any city in the world. The North Shore Mountains are in plain sight from virtually any location in the Greater Vancouver Region. The city is bordered to the west by the Pacific Ocean, from which you can see another mountain range: the Cascades. Once elements like a mild climate, world-class food scene and abundance of parks are considered, it’s no wonder Vancouver is routinely listed as a top 10 city in the world.
It is also routinely listed as one of the most expensive cities in the world, among other world-class cities like Hong Kong, Singapore, New York and Moscow. And while policy measures taken by federal and local governments have served to dampen demand and increase supply in recent years, the high cost of living in Vancouver and the surrounding municipality augurs to remain a topic for years to come. Moreover, the Pacific Ocean and adjacent mountains aren’t going anywhere anytime soon…hopefully.
Over the past few decades, housing and rental prices in Vancouver proper were such that families and buyers looked to move into the suburbs to find more affordable living options. While renting or buying smaller apartments and condos might still be within reach for some in Vancouver, the surrounding Metro Vancouver area—comprising 23 cities, municipalities and villages—is where the majority of homes are sold.
Delving deeper into the data, information from nearly 40,000 houses sold in the last three years was examined focusing on five different areas of interest: sold price, floor area, lot size, age and days on market (DOM).
Of the 40,000 data points, the highest number of houses sold were not located in Vancouver. Rather, it is Metro Vancouver’s second largest city, Surrey, where nearly a quarter (23%) of homes were sold. Just under 14 per cent (13.9%) were located in Vancouver proper (Vancouver-West and Vancouver-East in the chart below) and 6.5 per cent were in Langley, a city which lies about 50 kilometres south east of Vancouver.
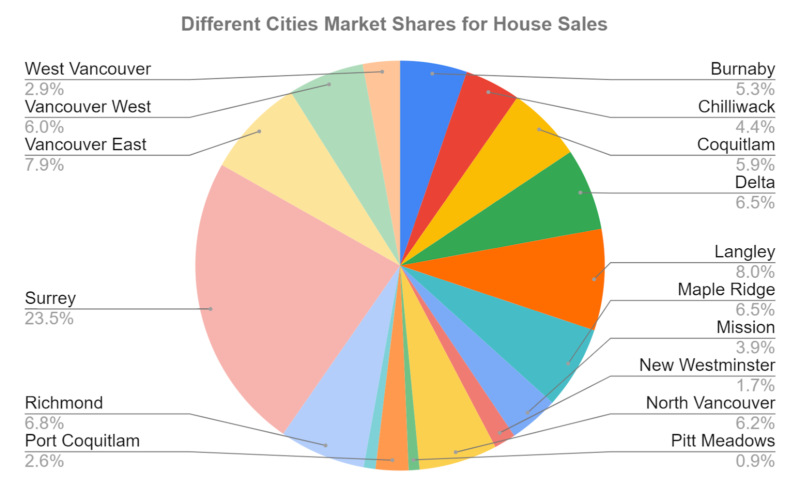
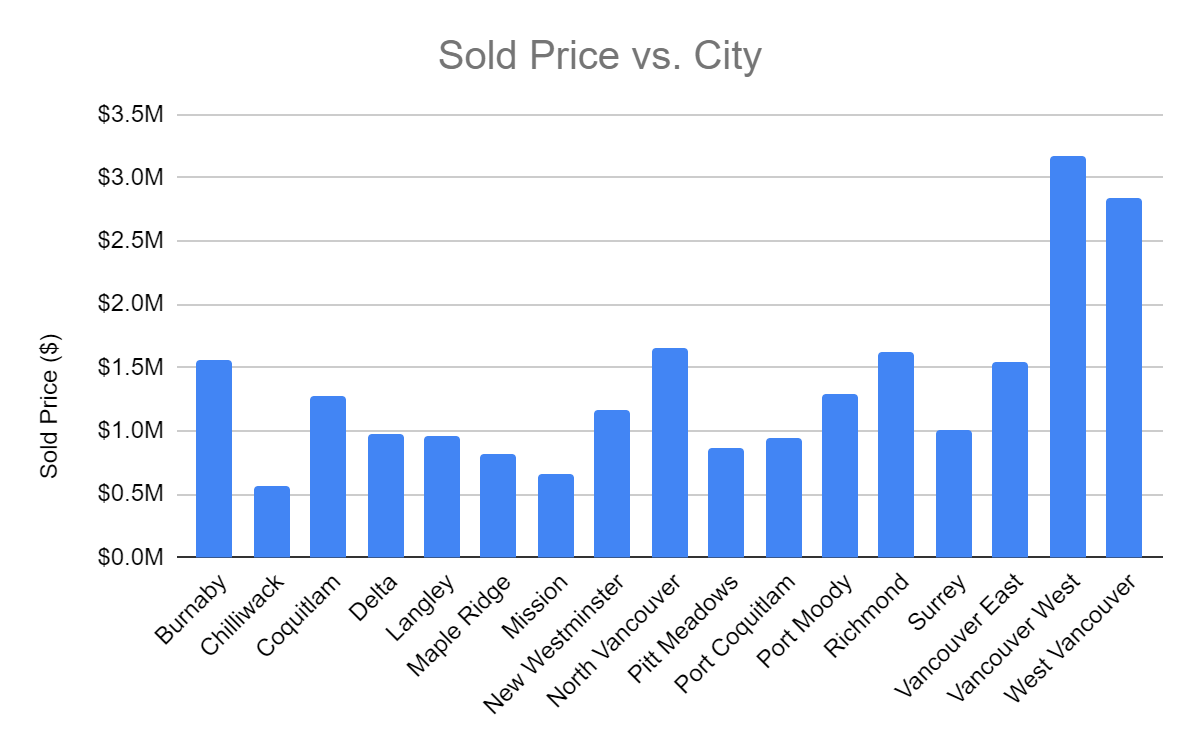
When price is considered, one might glean a better understanding of why more homes sell in the suburbs than in the City of Vancouver itself. Houses in Vancouver-West (located west of Main Street) and the municipality of West Vancouver (not to be confused with Vancouver-West) sold for almost double the price of all other municipalities. In fact, West Vancouver not only features some of the highest costs of housing in Metro Vancouver, but contains some of the most expensive postal codes in Canada.
On the higher end of the affordability spectrum are three municipalities located relatively far away from the city centre. Chilliwack, Mission and Maple Ridge are where those looking to live in the Lower Mainland British Columbia can find housing costing much less than in other surrounding municipalities. The average house in Chilliwack, costs around $550 thousand while the median house in Vancouver-East is more than $1.5 million; the median home price in Vancouver-West is almost $3.2 million.
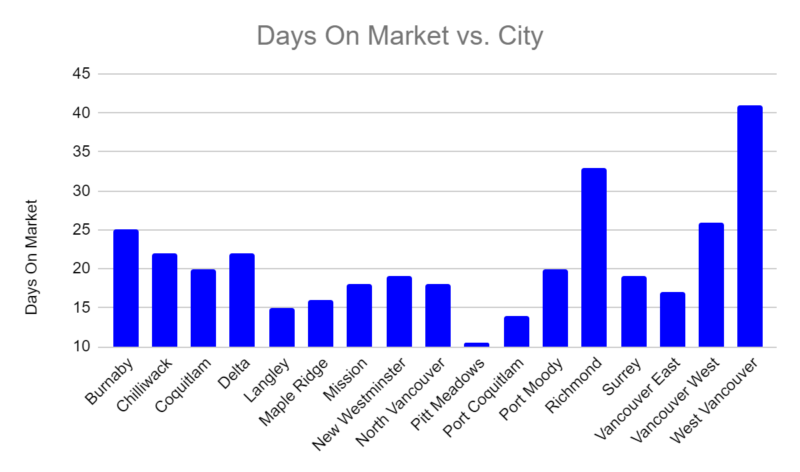
While sellers of homes located in Vancouver-West and West Vancouver can look forward to a hefty sum of money once the deal is closed, over the past three years they’ve had to wait much longer than sellers in other Metro Vancouver municipalities. Houses in West Vancouver spent an average of 40-45 days on market (DOM) whereas in Vancouver East that number is only 17.
Pitt Meadows (11 days) and Richmond are outliers on the low and high ends of the spectrum respectively, with somewhere between 15-25 days being regarded as normal. As of February 2020, the median DOM for a home is 19. But generally speaking, according to the data examined the higher the price, the more days spent on market.
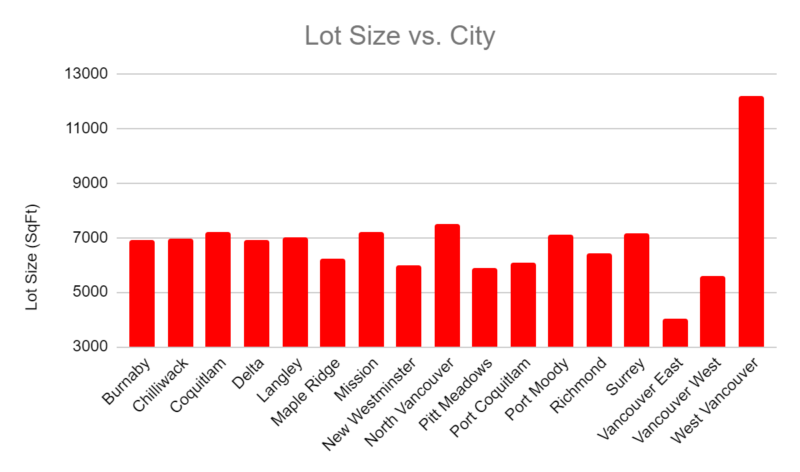
One of the appeals of moving to the suburbs, on top of more affordable housing and family-friendly amenities, is the appeal of larger homes and lot size. However, when lot sizes by Metro Vancouver are examined, it’s not necessarily in the “affordable” suburbs where the largest lots are located.
Lot sizes of houses sold in West Vancouver over the past three years are significantly larger than those of other municipalities. Vancouver-West on the other hand features some of the smallest lot sizes, with its neighbour Vancouver-East being the smallest. 7,000 square feet turned out to be a normal range in most municipalities with smaller lots located in Pitt Meadows (under 6,000 square-feet), New Westminster, Port Coquitlam and Maple Ridge.
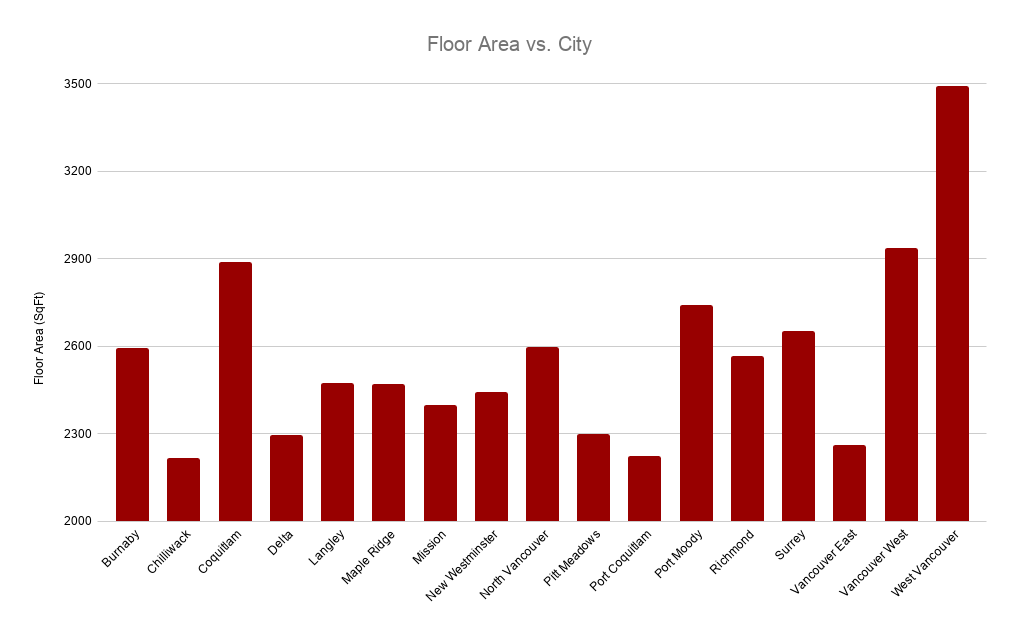
Although there is relatively little variance in lot sizes by municipalities, floor area does not follow suit. West Vancouver homes are where the most floor area is found averaging just under 3,500 square feet. And while Vancouver-West ranks second among Metro Vancouver municipalities, the suburb of Coquitlam—situated approximately 20km east of Vancouver proper—ranks just behind Vancouver-West at 2,900 square feet. Adjacent municipality Port Moody also has relatively large houses (2,750 square feet), but the third city in the Tri-Cities, Port Coquitlam, is near the bottom of the list. Chilliwack and Delta provide interesting examples of cities with bigger lot sizes but smaller houses by floor area.
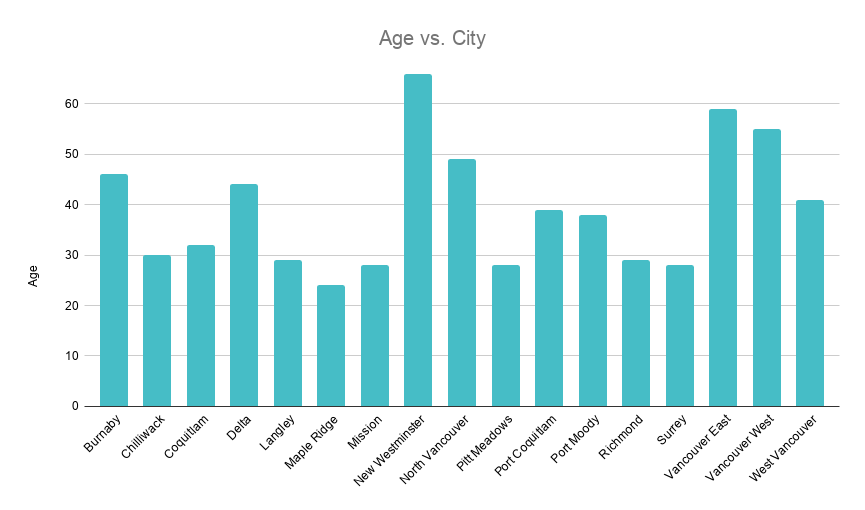
Canada is a relatively young nation whose provinces and territories are correspondingly young. British Columbia, for example, was founded in 1858 only becoming an official Canadian province in 1871. Thus looking at the age of houses in Metro Vancouver as opposed to say, London, England, is less of a historical exercise. Nevertheless, looking at the median age of houses sold in the past three years yields some interesting observations.
As the oldest city in Western Canada, New Westminster is where the oldest houses in Metro Vancouver are found, with a median age of 66 years. Vancouver proper is where the next oldest houses are situated: Vancouver East’s median house age is 59 and Vancouver West’s is 55. Conversely, the newer and growing suburbs of Surrey—the fastest growing city in Canada—Maple Ridge and Pitt Meadows are where one would find the newest homes, ranging from 24 years to 28 on average.
Vancouver’s housing market is nothing if not dynamic. After decades of dizzyingly fast growth, 2018 and 2019 were years in which the housing market modestly retreated or stayed the same. Government intervention in the form of higher minimum down payments, longer permit wait times, foreign buyer taxes and stricter financial requirements for mortgages introduced in the past few years have made it less clear that the pace and heat of Vancouver’s housing market will continue to grow year after year.
However, Government policies and markets aren’t fixed entities—they evolve, adapt and fluctuate like most human creations. Canada’s Federal government recently introduced an update to the mortgage Stress Test, effectively giving prospective homebuyers easier access to more expensive homes. Whether this policy is isolated to the federal government or the first chip to fall in a slew of looser mortgage restrictions is yet to be seen. What’s clear is that where there’s a will, there’s a way, and people from all over Canada and around the world have the will to live in Vancouver.
